Will Your Retirement Fund Last? Risks On The Road Of Retirement Income (MAR 2020)

“The stock market drops 30 percent the year that you retire and you start withdrawing 4 percent annually from what was previously a £200,000 pension fund or any other investment account (£8,000 annually). In 12 months, your portfolio falls to £132,000, and 4 percent is no longer a sustainable withdrawal rate. Should you continue drawing £8,000 annually, then your withdrawal rate becomes 6.06 percent annually.”
Timing Risk & Randomness
Retirement is full of major, often irreversible financial decisions and hidden risks. As of the date of this writing, we are facing with a major crisis, the coronavirus global spread. The FTSE All Share Index (measuring broadly the UK economy) dropped 30% from 12/02/2020 to 13/03/2020.
FTSE All Share Index [12 February 2020 – 10 March 2020]
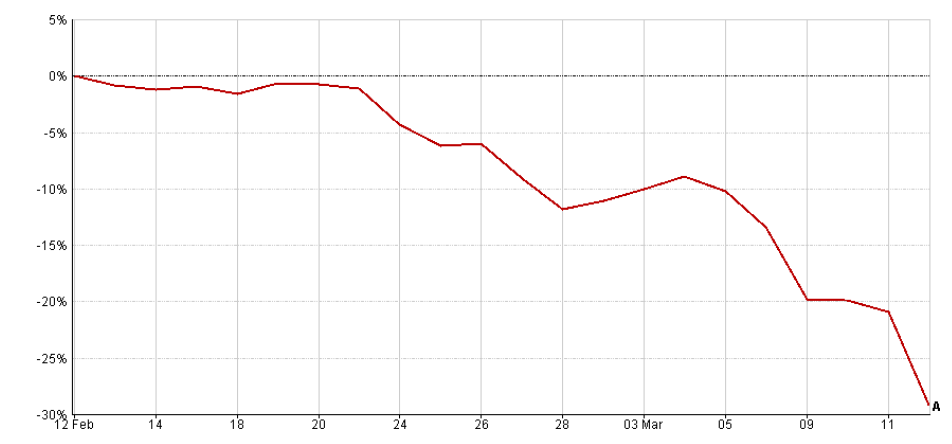
Source: YF | Pricing Spread: Bid-Bid ● Data Frequency: Daily ● Currency: Pounds Sterling
The effects of timing cannot be ignored. If you get off to a good start, Drawdown Pension is more than likely to work in your favor. For instance, if you had invested in 2003 (right after the internet bubble) and invested mainly in equities, your fund value, despite taking withdrawals, is likely to be worth more now than at the start date despite the major fall in 2008. Conversely, someone who commenced in early 2007 would have suffered a major loss in 2008 (credit crunch) of negative or weak investment performance in the first year of retirement.
A final point is that of randomness. Whilst market surges and crashes do not usually appear out of nowhere, they do usually catch many investors by surprise (they literally “did not seeing it coming”).
Reverse pound cost averaging – Sequence of returns
During your retirement, investments (units or shares) are being sold on a regular basis to fund your retirement income regardless of the price per share. If share values are low, you will have to sell more shares to get your predetermined withdrawal amount than when share values are high.
As you’re aware, it’s important to buy when share values are low and sell when share values are high. Selling regardless of market conditions is not wise.
It’s important to be strategic with your withdrawals and take advantage of certain market conditions. While timing the market isn’t generally recommended when you’re putting money into investments, timing the market when you’re withdrawing from investments isn’t only helpful, it’s many times necessary.
Let’s take a look at how reverse pound-cost averaging can negatively affect an investor who is in retirement and taking withdrawals. Let’s suppose the investor starts with £100,000 or 10,000 shares. The investor plans to take £417 per month from their retirement account every month, that’s a 5 percent withdrawal annually. Let’s see how this breaks down over the course of a year in the table below:
| MONTH | WITHDRAWAL | SHARE PRICE | SHARES SOLD |
January | £417 | £10 | 42 |
February | £417 | £9 | 46 |
March | £417 | £8 | 53 |
April | £417 | £7 | 60 |
May | £417 | £6 | 70 |
June | £417 | £5 | 84 |
July | £417 | £6 | 70 |
August | £417 | £5 | 84 |
September | £417 | £6 | 70 |
October | £417 | £5 | 84 |
November | £417 | £6 | 70 |
December | £417 | £7 | 60 |
Performance
Fund lost | -30% |
Withdrawal | £5,000 |
Shares sold | 793 |
Shares remaining | 9,202 |
Ending value | £64,449 |
Loss | -£30,551 |
Gain | -32.15% |
As you can see, while the investor’s withdrawal rate remains the same, the price per share fluctuates and therefore requires a variable number of shares to be sold every month. Sometimes the price per share is high, other times, the price per share is low.
How did reverse pound-cost averaging affect the investor? Negatively. Here’s the break down . . . .
The fund, unsurprisingly, lost 30% of its value with a total withdrawal of £5,000. There were 793 shares sold and 9,207 shares remaining. The ending value of the account was £64,449. This means there was a £30,551 loss which translates to a 32.15% loss.
As you can see from the example, withdrawing money on a regular basis during volatile and negative markets not only reduces the account value, it also reduces it even further due to the negative affects of reverse pound-cost averaging. This is the result of the sequence of returns.
Inflation Risk
The effect of rising prices can threaten a retiree's standard of living. Your strategy for creating retirement income must seek to keep your income on pace with inflation.
The inflation risk is around losses you could incur in the true value of your capital or income from your drawdown plan over years as a result of inflation. This is a hidden factor. You could actually see rises in your capital values or income, but still be worse off because of inflation.
Imagine a scenario where you have a pension drawdown value of £220,000 and you are drawing £10,000 per year income. The value of the income is level for the next five years and the value of the pot increases from £220,000 to £225,000. That doesn’t look too bad a result? However, now look at the true value of these figures five years later, assuming different inflation rates;
(The true value is assessed to be the spending value in today’s terms)
In Five Years | £225,000 Pot “True Value” (£) | £10,000 Income “True Value” (£) |
@2% p.a. inflation | £201,600 | £8,960 |
@4% p.a. inflation | £176,265 | £7,834 |
@6% p.a. inflation | £148,905 | £6,618 |
For example, over 20 years £10,000 falls in value to a true value figure of £4,563 assuming a 4% inflation rate per year.
Longevity Risk
No retiree stops needing money. So a good question to contemplate is, "How long could my retirement last?" Think about the oldest person you know? Is he or she over 80? or 90? The fact is, a married couple age 65 has a 25% chance that the surviving spouse will live to age 98! (Source: ONS)
Your strategy for creating retirement income should provide a "floor" of monthly income you can't outlive.
Reality Check Performance Research
Our client risk profiling tool, Finametrica, includes back-testing the performance of a set of investment portfolios on a month-by-month basis from January 1, 1970 to December 31, 2019.
In relation to asset portfolios where income is drawn systematically, i.e. pension drawdown, portfolio performance was calculated by using total-return region indices as proxies for sector performance. No allowance was made for fees and taxes. The objective was to develop a clear understanding of the broad historical risk and return patterns for a representative set of portfolios under the stress of systematic withdrawals.
While recognising that the future will not be an unvarying repetition of the past, the patterns evident in the past are the best guide we have to the patterns we will experience in the future. And it is a feel for, and understanding of, patterns and relationships that is the goal.
Let's now consider the results from an investment portfolio where income is drawn regularly, such as a pension drawdown plan that invests 50% in growth assets (shares/property) and 50% in defensive assets (bonds/fixed income), with a starting value of £100,000 and a real 3%, 5% or 7% annual drawdown rate, i.e. for a 5% annual drawdown rate, the monthly withdrawal amount of £417 increased with inflation. Real end values means after inflation, E.g. if the return is 5% and inflation is 2% then the real end values are based on 3% return.
Historical Real End Values of £100,000 After 10 Years into Retirement [Period 01/01/1970 - 31/12/2019 - month-by-month basis]
3% | 5% | 7% | |
Best | £254,261 | £220,216 | £190,024 |
Good | £226,332 | £195,647 | £162,663 |
Average | £138,421 | £110,786 | £83,150 |
Poor | £60,374 | £40,069 | £19,939 |
Worst | £52,004 | £31,244 | £9,635 |
Real End Values as a Multiple of Annual Drawdowns
3% | 5% | 7% | |
Best | 84.8 | 44 | 27.1 |
Good | 75.4 | 39.1 | 23.2 |
Average | 46.1 | 22.2 | 11.9 |
Poor | 20.1 | 78 | 2.8 |
Worst | 17.3 | 6.2 | 1.4 |
For a ten-year plan with a real 5% annual drawdown rate, the Historical Average result was an end value of £110,786. A Good result was £195,647 and a Poor result was £40,069.
There's evidence that investors are likely to adjust their spending depending on market conditions and the value of their portfolio before the end of the ten-year period.
Nevertheless it's worthwhile considering the End Values in the context of sustainable future withdrawals for comparative purposes. E.g. the average Real End Value of the original 5% annual drawdown will allow an extra 22.2 annual payments whereas the worst Real End Value will only allow an extra 6.2 annual payments.
As you can see from the above the Road Of Retirement is full of serious challenges that need to be addressed before you set off to a sunny beach. A big part of generating enough income to live off of in retirement is identifying and mitigating risks to that income stream.
Falling markets, inflation and longevity represent a present and clear danger to your retirement lifestyle and security.
We are here though to guide you and help avoid serious mistakes, as we have the expertise to help you mitigate all post retirement risks, by devising smart strategies of how to spend your savings. We will ensure that you don’t outlive your nest egg, and also you don’t live more frugally than you need to.
Notes
The above analysis was done on a monthly basis for an asset allocation comprising 30% Fixed Interest, 20% Int. Fixed Interest, 30% UK Equities and 20% Int. Equities. Total return indices, shown below, were used as proxies for asset sector performance. No allowance was made for tax or fees. The asset allocation was rebalanced annually.
The indices chosen were:
Cash |From Jan 91 ICE BofAML GBP 6M Dep OR CM TR Index | From Jan 70 United Kingdom Total Return Bills Index (Source: Global Financial Data, Inc.)
Fixed Interest |From Jan 76 FTSE Actuaries UK Conventional Gilts All Stocks TR Index | From Jan 70 United Kingdom 10 Years Govt Bond Total Return Index (Source: Global Financial Data, Inc.)
Int. Fixed Interest | From Jan 86 JPM GBI Global Traded TR Index | From Jan 70 to Dec 85, a proxy based on 10 year US Government Bonds
UK Shares | FTSE All Share TR Index
Int. Shares | MSCI World ex UK Gross Index
Bank Deposits | From Jul 18 ICE BofAML GBP 12M Dep OR CM TR Index | From Jan 75 Bank of England, Sterling Certificate of Deposit rates (3 months) end month From Jan 70 to Dec 74 Global Financial Data’s UK 3-month Time Deposit Rate
Inflation | From Jan 87 United Kingdom Retail Prices Index – All Items (Source: UK National Statistics.) | From Jan 70 to Dec 86 Global Financial Data, Inc. equivalent was used