Retiring without a withdrawal distribution strategy & professional advice is a very courageous act but the path is very risky since you will be leaving your future to chance (MAR 2020)

In an effort to Manage Retirement Income we can help you prepare for the challenges you will face throughout your post retirement life assuming you have investable liquid assets and withdraw regular income to support your lifestyle.
The road of retirement should be paved with more than good intentions. Soon-to-be retirees need to develop and follow a retirement income plan that balances current lifestyle and long-term sustainability of the retirement portfolio. The Road of Retirement (Managing Retirement Income) series of articles will provide some best practices for accomplishing this balance and make you fully aware of the challenges ahead.
Sequence of Returns
As we know, the investment markets do not go up every year by a fixed amount – they fluctuate over time. There is risk, but this risk is understood. Each year the market provides a real return on average, but the actual return is going to fluctuate around this real return.
The sequence of returns risk is something which can apply both in pre-retirement and post-retirement. Two investors may enjoy the same average return on the investments in their portfolio, but may still experience very different outcomes if they experience a different sequence for when these returns arrive. This can affect both those who are saving and contributing to their portfolio over time, and those who are withdrawing a constant stream of cash flows from their portfolio during retirement.
Sequence of returns is simply the order in which returns are realised by a retiree. The consequences of a bad sequence of returns, especially early in retirement, can mean premature depletion of the portfolio. Retirees need to avoid being in the position of having to sell during inopportune market environments. Being forced to sell at the wrong time can result in “reverse pound cost averaging”. Put it simply, it means as you continue selling shares to fund your retirement income during a downturn you are reducing the number of shares you hold within your plan and when the recovery takes place you are not going to be at the starting position as you now hold less shares.
Examples
To illustrate the importance of the sequence of returns to retirees and just how misleading using a historical average return can be, let us look at a 20-year period (1989–2008) of the returns for the FTSE All Share Index (which is a broad measure of the UK economy).
You can see from table below that the average return for this 20-year period was 9.45%. Reverse the sequence, 2008–1989, and once again, the average annual return is 9.45%.
Sequence Sequence
Years Years 1989 to 2008 Years 2008 to 1989
| 1 | 1989 | 26 | 1989 | -30 |
2 | 1990 | -10 | 1990 | 5.31 |
3 | 1991 | 21 | 1991 | 16.75 |
4 | 1992 | 21 | 1992 | 22 |
5 | 1993 | 28 | 1993 | 13 |
6 | 1994 | -6 | 1994 | 21 |
7 | 1995 | 24 | 1995 | -23 |
8 | 1996 | 17 | 1996 | -13 |
9 | 1997 | 24 | 1997 | -6 |
10 | 1998 | 14 | 1998 | 24 |
11 | 1999 | 24 | 1999 | 14 |
12 | 2000 | -6 | 2000 | 24 |
13 | 2001 | -13 | 2001 | 17 |
14 | 2002 | -23 | 2002 | 24 |
15 | 2003 | 21 | 2003 | -6 |
16 | 2004 | 13 | 2004 | 28 |
17 | 2005 | 22 | 2005 | 21 |
18 | 2006 | 16.75 | 2006 | 21 |
19 | 2007 | 5.31 | 2007 | -10 |
20 | 2008 | -30 | 2008 | 26 |
Average Return | 9.45% | 9.45% |
Source: YF | Pricing Spread: Bid-Bid ● Data Frequency: Calendar Year | net income reinvested
Average market returns over longer time frames do not tell the whole story, sequence of returns matters. An investor who retires during a period of low inflation and increasing market prices may find that their retirement portfolio lasts 30 years. Another investor who retires with the same size retirement fund during a period of increasing inflation and declining market prices could fall short of their goal for a 30-year retirement.
To more fully understand the impact of the sequence of the returns, review the 1989– 2008 returns and note how eight of the first 10 years had positive returns, which would have allowed the portfolio to grow nicely. Conversely, for the 2008–1989 sequence, the first year experienced a substantial decline of negative 30% and four of the first 10 years were negative as well. This poor sequence would have created pressure on a portfolio that was already undergoing the stress of systematic withdrawals.
Let us illustrate this in a simplified world to make this vulnerability very clear and prominent. We said earlier that sequence of returns risk affects investors during the accumulation phase of their life and distribution phase during retirement.
Accumulation Phase
So let us consider two hypothetical investors (A&B) who are doing everything right with regard to their retirement planning. When retirement is still 30 years off in the horizon, they begin saving £100 per month on a constant basis, we have not included inflation increases on their contribution. We have assumed that both investors invest 100% in equities and in developed economies, including the UK, as represented by the MSCI World Index. We have not taken into account any charges or fees.
Where do they actually end up?
The graphs below show the final fund value of both investors who worked and saved for 30 years and get 30 years of market returns, but who differ only in which 30 year period they worked and saved in this 30 year period. Investor A started on 01/02/1976 and retired on 01/02/2006 and investor B started on 01/02/1979 and retired on 01/02/2009.
Though they could expect equal wealth, the outcome differs by £102,965 in fund size.
These are very different outcomes for people who otherwise behaved exactly the same. This is despite the fact that 27 years of their 30 year careers overlapped with one another.
Investor A

Source: YF | Pricing Spread: Bid-Bid ● Data Frequency: Monthly ● Saving Date: 1st of the Month ● Regular Investment: 100.00 ● Currency: Pounds Sterling | net income reinvested
Investor B
Source: YF | Pricing Spread: Bid-Bid ● Data Frequency: Monthly ● Saving Date: 1st of the Month ● Regular Investment: 100.00 ● Currency: Pounds Sterling | net income reinvested
The problem also applies in retirement, perhaps even more strongly, especially if retirees are using a constant inflation-adjusted withdrawal strategy.
Time of Retirement
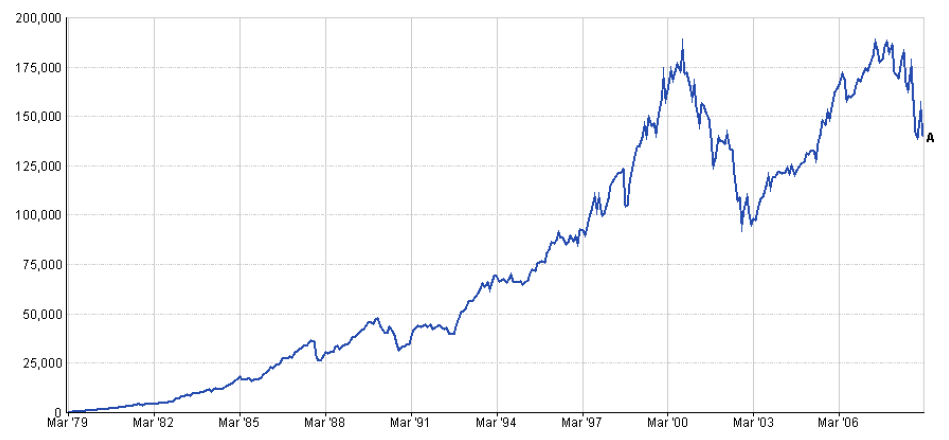
The graphs below show now three different investors that retiring in the same decade (2000/2010) with an initial pension fund value of £100,000. All investors withdraw 5% per year of the initial investment payable monthly in arrears (£416.66 per month) without inflation increases. All investors again invest 100% in equities and in developed markets similarly to the example above.
The graphs show their fund value after 10 years into retirement. The first one who retired on 01/02/2000 has an outstanding balance on his retirement account of £40,202 after 10 years, the second one who retired on 01/02/2003 has £159,150, and the third one who retired on 01/02/2009 has £235,512. The first one retired the year after which we had three consecutive falls on the stock markets (period 2000-2003, internet bubble), the second one retired just after the 2000-2003 period, when the markets bounced back but was affected by the 2008 credit crisis, and the third one retired just after the 2008 downturn and enjoyed a nice growth.
The effects of timing cannot be ignored. If you get off to a good start, withdrawing income from retirement assets is more than likely to work in your favour as this example highlights.
Investor A

Source: YF | Pricing Spread: Bid-Bid ● Initial Investment: 100000.00 ● Data Frequency: Monthly ● Withdrawals Date: 1st of the Month ● Withdrawals Amount: 416.66 Monthly ● Currency: Pounds Sterling | net income reinvested
Investor B
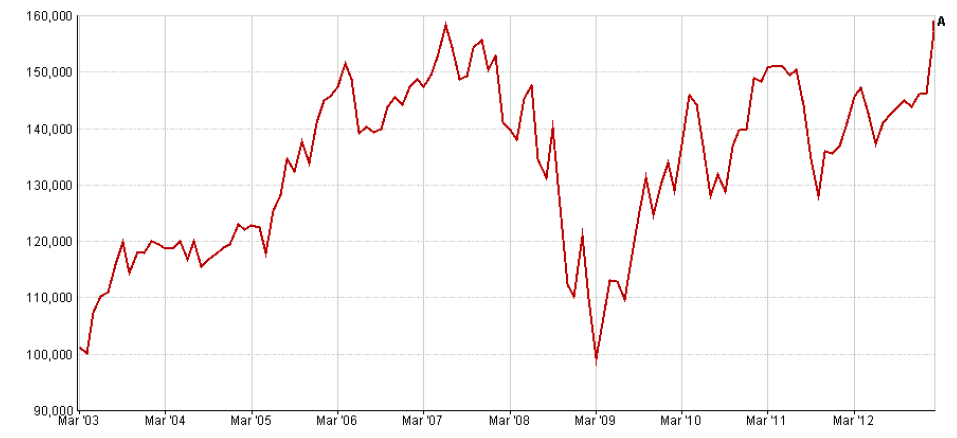
Source: YF | Pricing Spread: Bid-Bid ● Initial Investment: 100000.00 ● Data Frequency: Monthly ● Withdrawals Date: 1st of the Month ● Withdrawals Amount: 416.66 Monthly ● Currency: Pounds Sterling | net income reinvested
Investor C
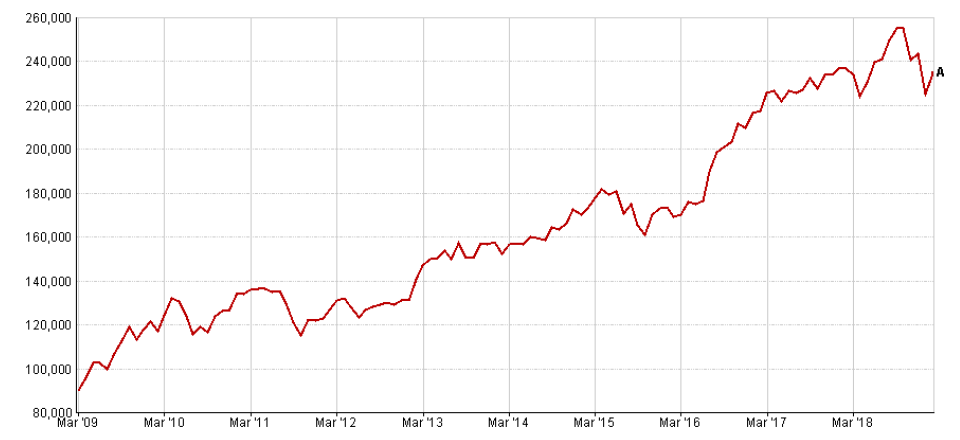
Source: YF | Pricing Spread: Bid-Bid ● Initial Investment: 100000.00 ● Data Frequency: Monthly ● Withdrawals Date: 1st of the Month ● Withdrawals Amount: 416.66 Monthly ● Currency: Pounds Sterling | net income reinvested
These hypothetical investors experienced very different outcomes based on the very random factor of when they were born and which years comprised their working period and retirement period.
It is worth noting that the above hypothetical examples assume a fixed level of withdrawal every month. An increasing level of income adjusted annually for inflation together with charges and fees, would have made the fund values look a lot worse after 10 years. Also all investors invested 100% in equities. A more balanced portfolio would have not shown such a dramatic result for investor A.
Assuming all investors had invested in a medium risk portfolio with 60% allocation to growth assets and 40% defensive and now retiring on 01/06/2007, then investor's fund value would have been £74,148 on 01/02/2009. Although his portfolio would have bounced back, as there has been a very good market run from 2009 to now, but seeing a nearly 26% fund depletion after two years into retirement would have caused a lot of anxiety and stress, the last thing someone needs after 30/40 years of working life.
Investor - 60%/40% Split

Source: YF | Pricing Spread: Bid-Bid ● Initial Investment: 100000.00 ● Data Frequency: Monthly ● Withdrawals Date: 1st of the Month ● Withdrawals Amount: 416.66 Monthly ● Currency: Pounds Sterling | net income reinvested
We assumed that the above portfolio 60/40 split was invested as: UK Property 15%, UK Conventional Gilts All Stocks 10%, UK Equities 20%, World ex UK Equities 25%, UK Sterling Non-Gilts 1-5Years 5%, UK Sterling Non-Gilts All Maturities 25%. Past Performance does not guarantee future results. Investments carry risks, including possible loss of principal. The views expressed in this article are subject to change. Diversification does not assure or guarantee better performance and cannot eliminate the risk of investment losses. The performance of any index is not indicative of the performance of any particular investment. Unless otherwise noted, index returns reflect the reinvestment of income dividends and capital gains, if any, but do not reflect fees, or other expenses of investing. Care has been taken to ensure that the information is correct but it neither warrants, represents nor guarantees the contents of the information, nor does it accept any responsibility for errors, inaccuracies, omissions or any inconsistencies herein.
So what our conclusions:
To enter retirement assuming inflation adjusted income every year we believe it is an inefficient way to approach retirement. Although not impossible but it is better to plan that you will not withdraw every year an adjusted level of income for inflation.
Although annuity rates are at low levels presently, do not underestimate their value offering secure income, similarly to those people who have preserved benefits in final salary schemes. These types of benefits represent a different asset class so it helps to reduce overall risk.
A Safe Withdrawal Rate (SWR) is important because focuses on using a consistent income withdrawal strategy protecting you from not outliving your assets.
Making withdrawals from a retirement fund during a declining market leaves less money invested to increase during a rising market.
Failing to make annual adjustments that reflect changes in the retirement fund value may negatively affect long term longevity.
A well thought out investment portfolio structure set together with us effectively manages investor behaviour and positively influences investment outcomes.
The value of advice
The road of retirement without professional ongoing management of assets is a very risky approach when you rely on investable assets to produce income throughout your retirement life, especially when this income covers essential spending. We employ many different investment strategies to ensure our client's income is sustainable allowing them to enjoy their retirement life without stress and anxiety.
The longevity of your retirement portfolio is very sensitive to returns in the first few years of withdrawals. Negative returns early on can greatly reduce the life of your portfolio. That is why, it is important to have an appropriate asset allocation from day one in retirement.
Like other aspects of financial planning, managing the income you will receive during your retirement years requires careful planning. It is critical not to wait until retirement to start making your financial plans. Instead, reassess your financial status during your pre- retirement years so you can determine whether you can retire or need to defer it. Most importantly, talk to us, who will be able to determine your specific needs.